Avishai M Tsur
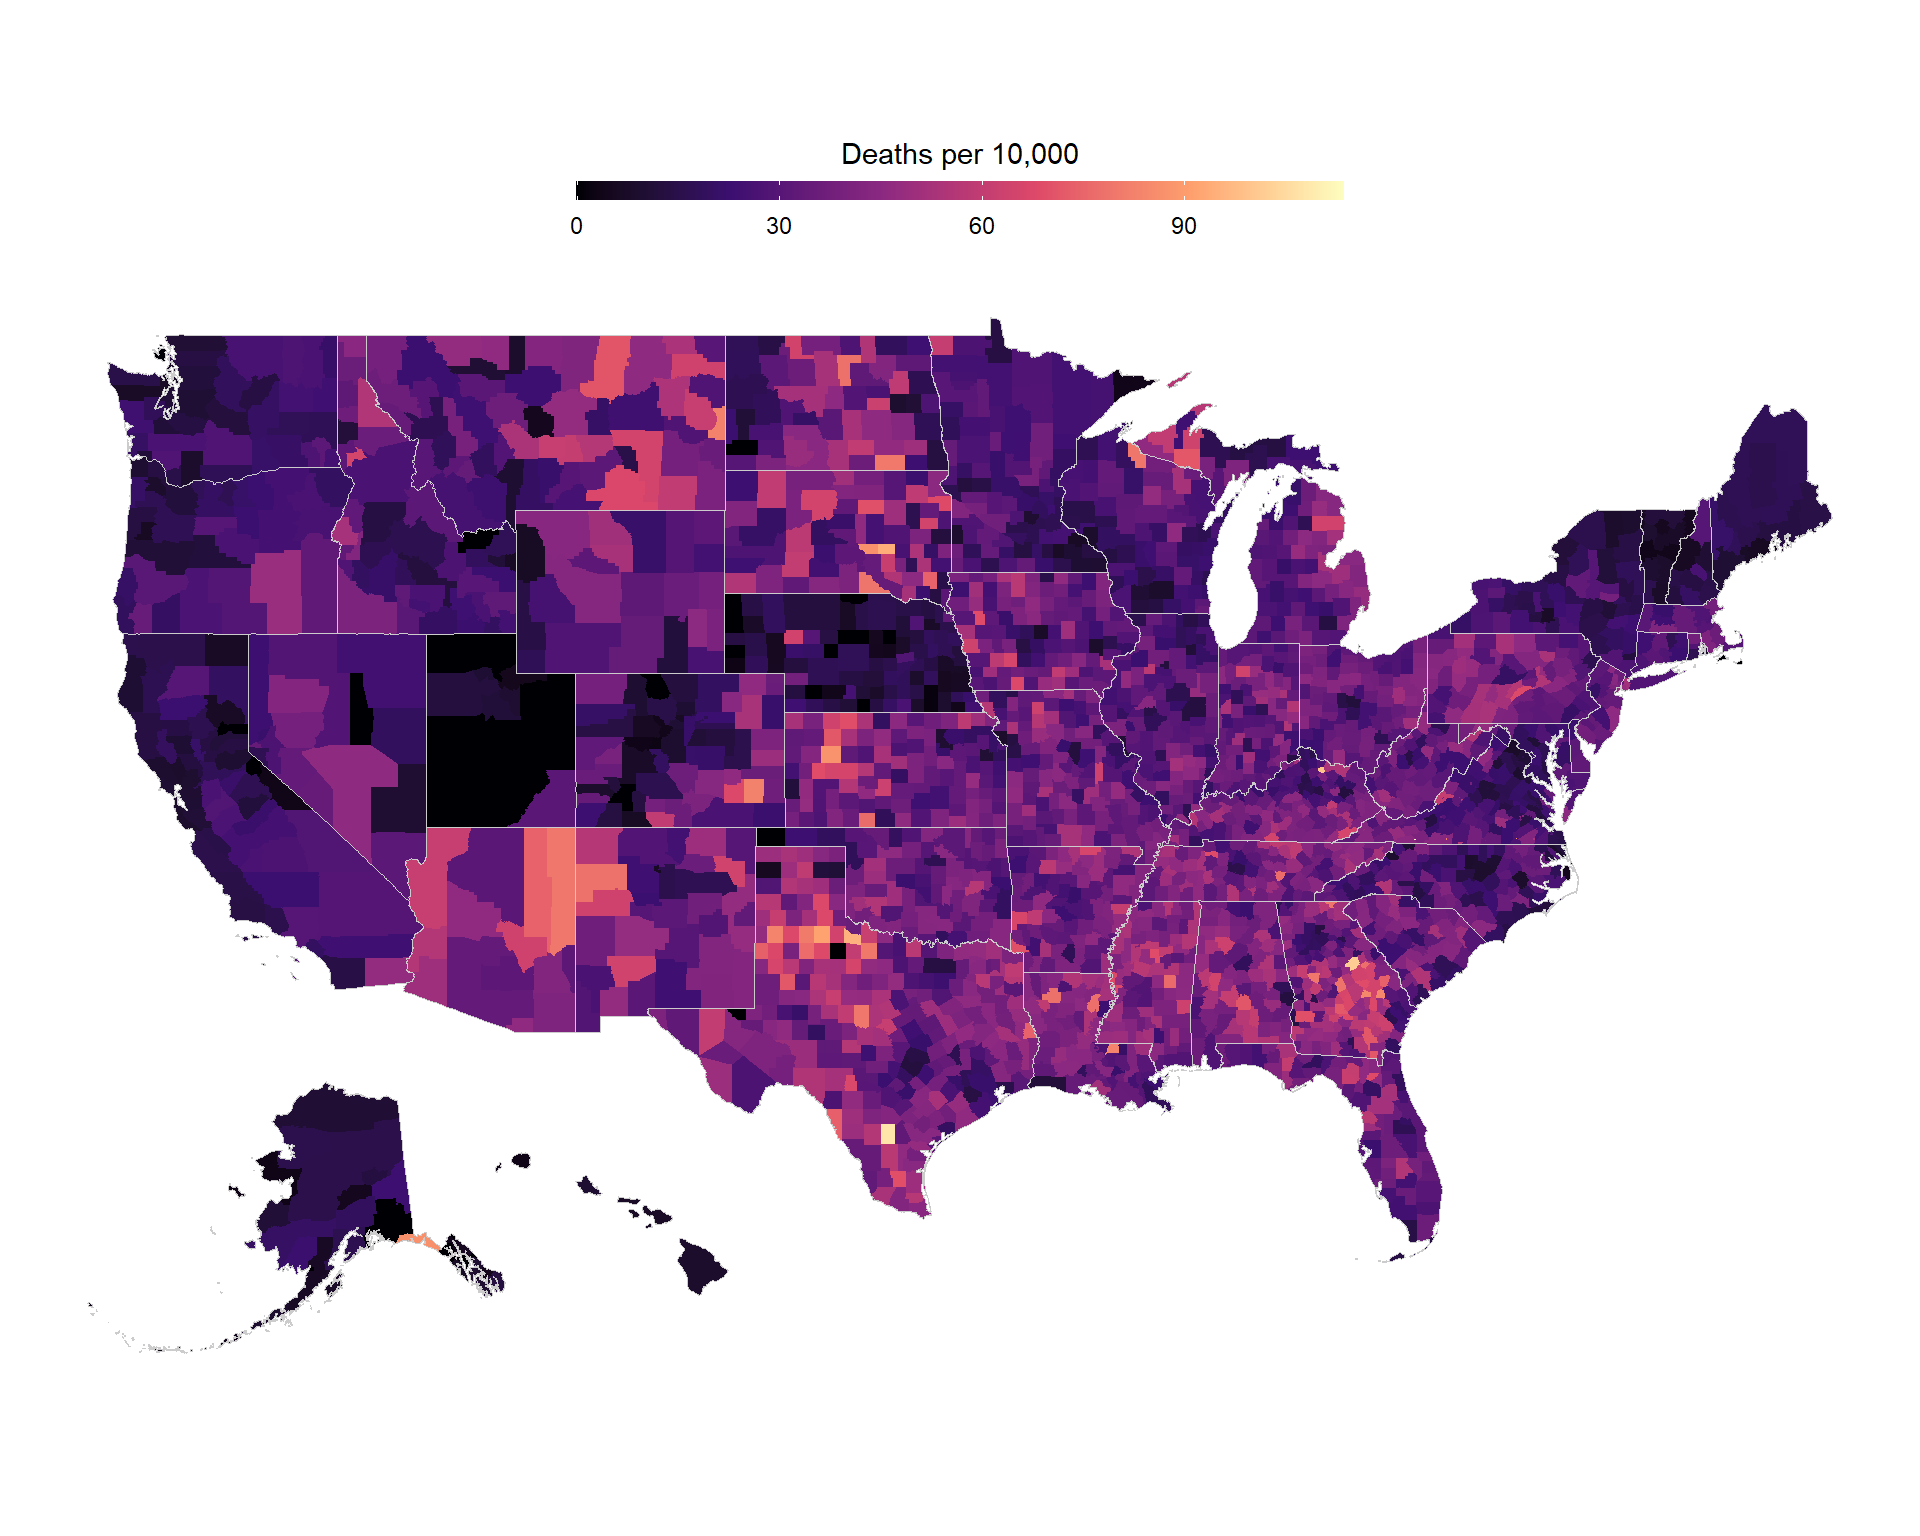
Selected COVID graphs
Not a lot of text this time.

Ten less known yet time-saving tidyverse functions
Easy to miss, hard to forget.
Reproducing the results of an RCT
Here I demonstrate how to use open RCT data to reproduce its results using R.
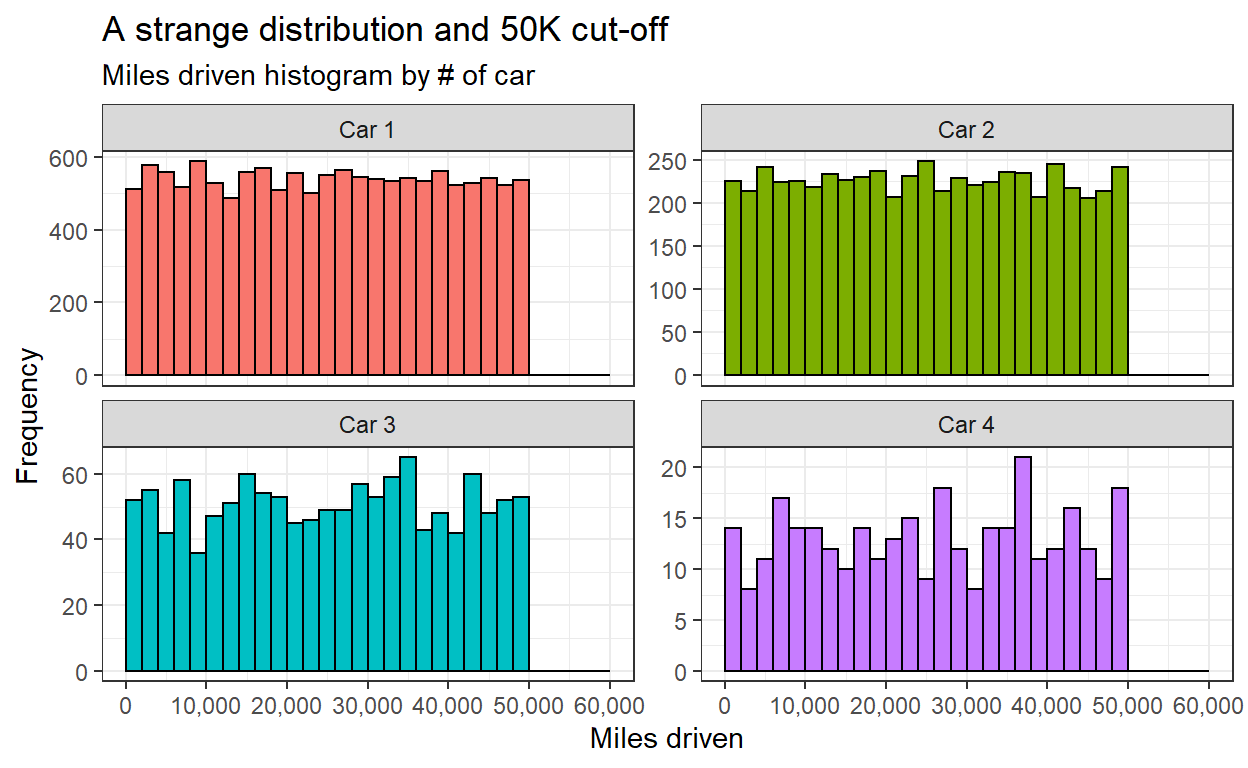
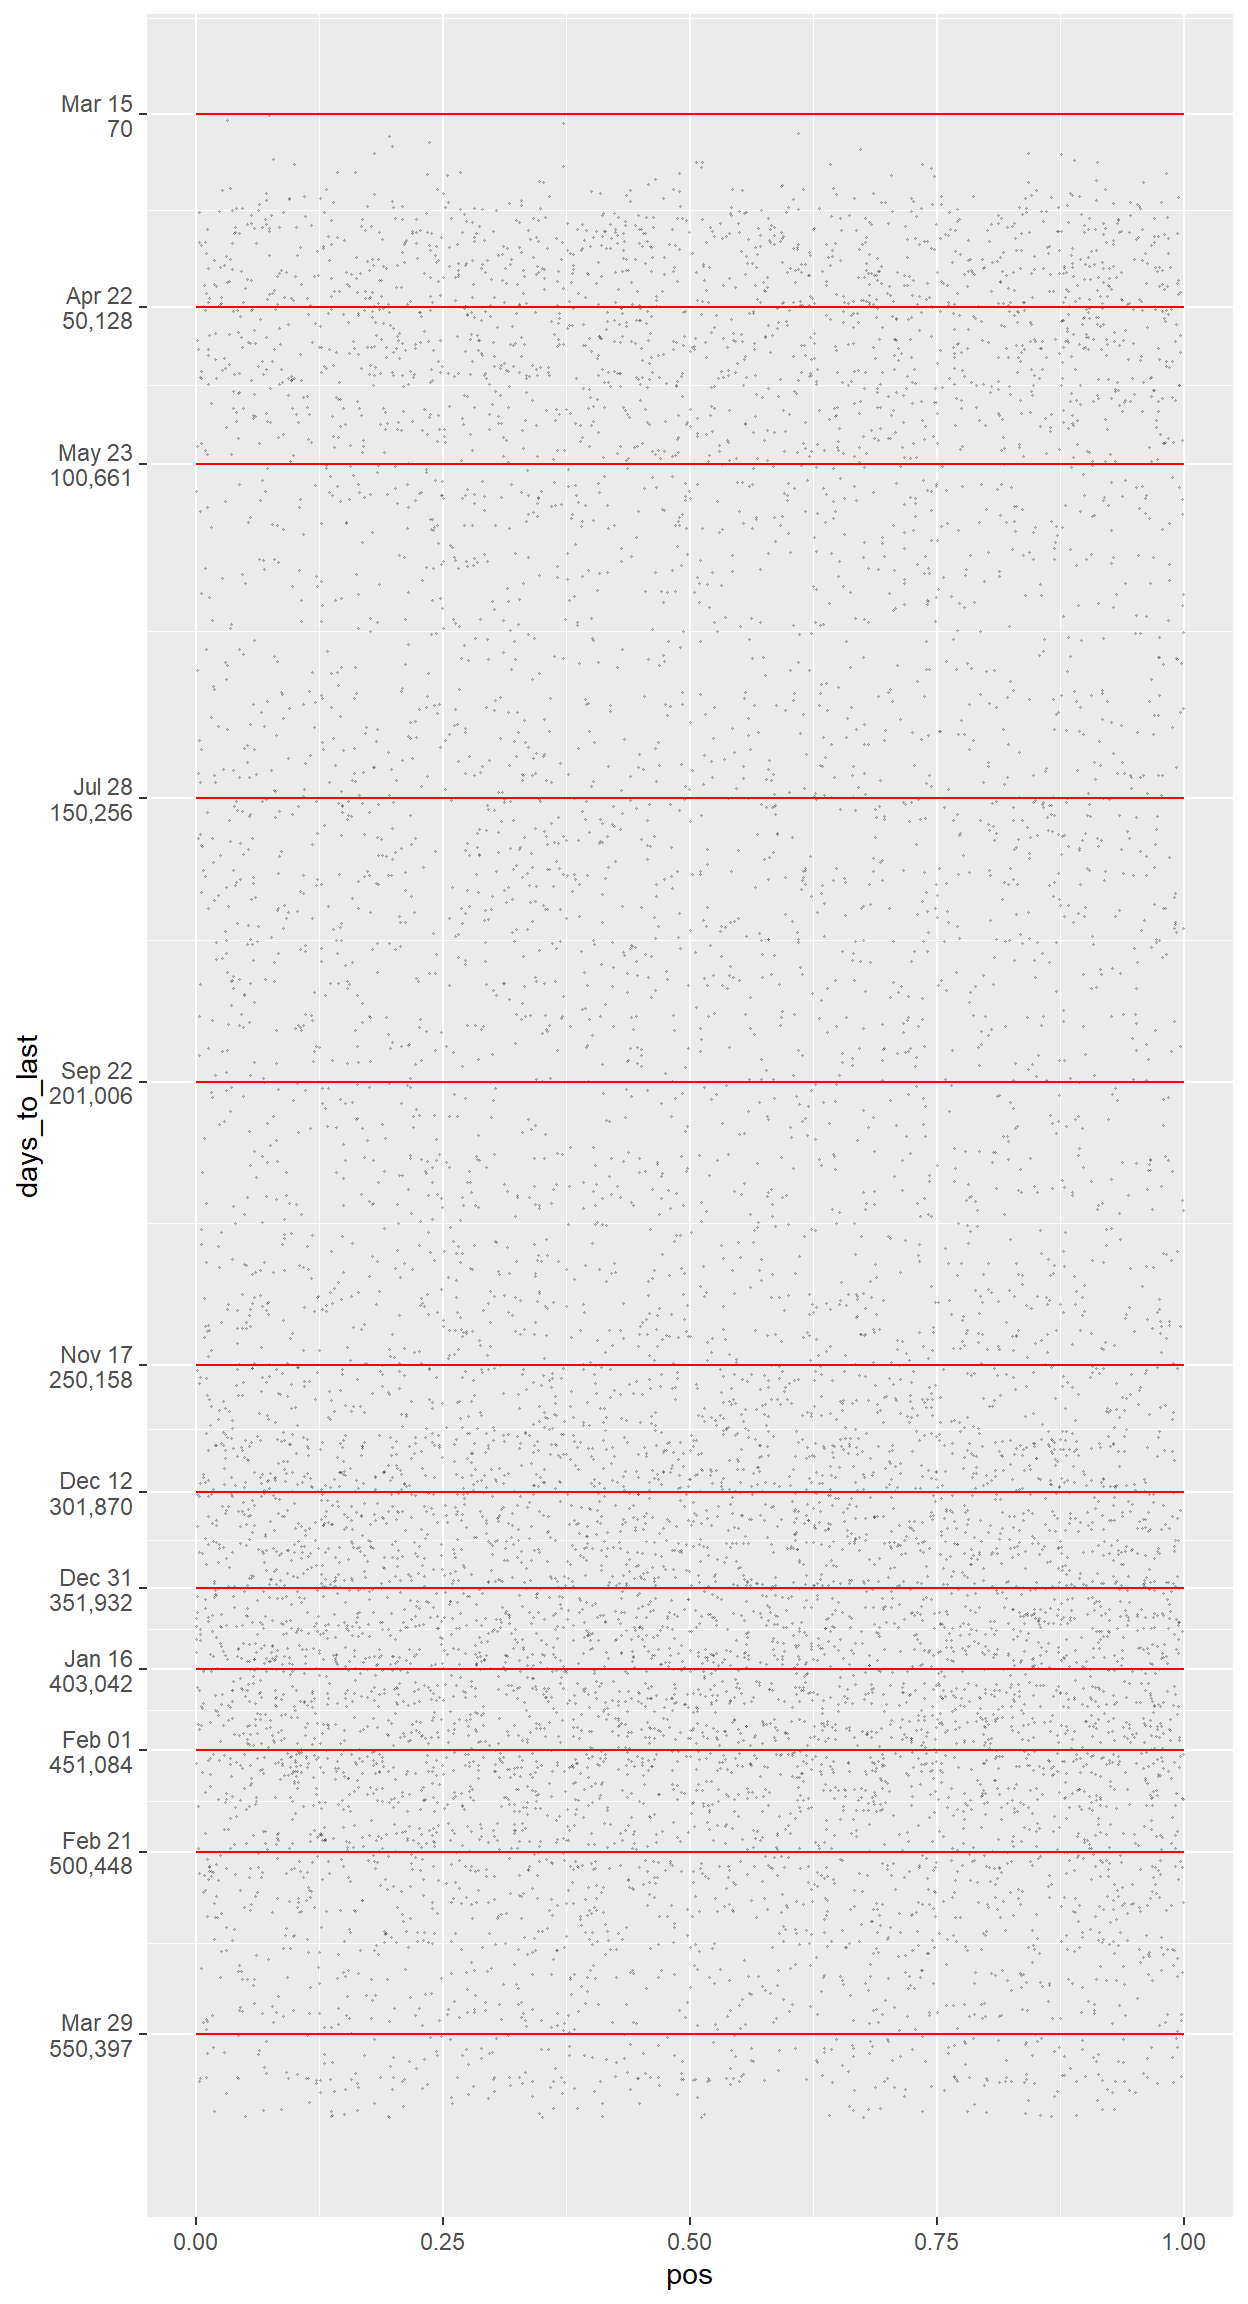
Replicating a fraud detection analysis
A blog post suggested evidence of fraud in an influential field experiment. I replicate their analysis and share the code.
Recreating The New York Times Wall of Grief
A graphic on Sunday’s front page depicted the totality of Covid’s devastation in the USA. I recreate it using R.
Welcome to website
Welcome to my new blog, website. I hope you enjoy reading what we have to say!